My challenge for day 13 of 100 days of no-code was to create a step by step guide using Scribe. I was so excited to discover scribe because I often find tutorial writing to be so tedious and Scribe made it a breeze.
I'm excited to share with you a tool I built for my friend Maks, a talented massage therapist in Charlotte NC. Maks is a warm and personable massage therapist who has built up his business by offering the highest quality massages with an inclusive approach to all clients. He doesn't just listen to his clients; he really hears them. And he listens in a way that allows him to really understand what they need from him as their massage therapist.
Maks and his team did some incredible things for me when I was nursing a shoulder injury last year, and it's been incredible to watch him grow as both a person and a business owner.
Maks generates a large amount of data while working with his patients, but trying to interpret all that data can be difficult. I recently set out to build a page that summarizes assessment data and allows Maks and his team to easily discern how a particular symptom has gotten better or wose over time.
Here's how I did it:
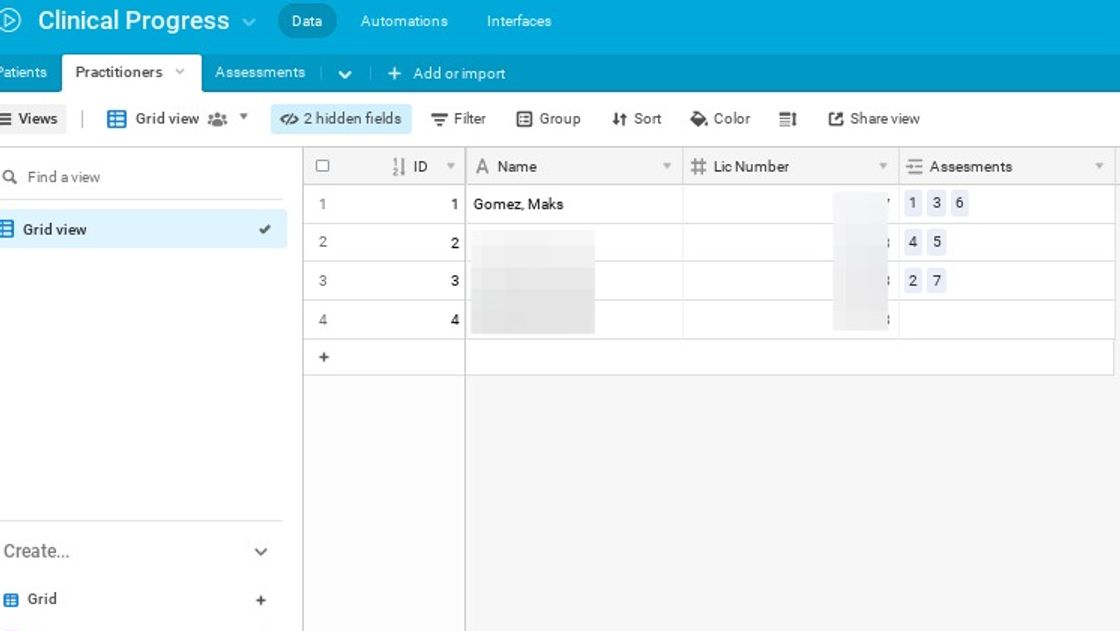
I asked Maks to create 3 tables for me in Airtable. One for Patients, one for Practitioners, and one for Assessments.
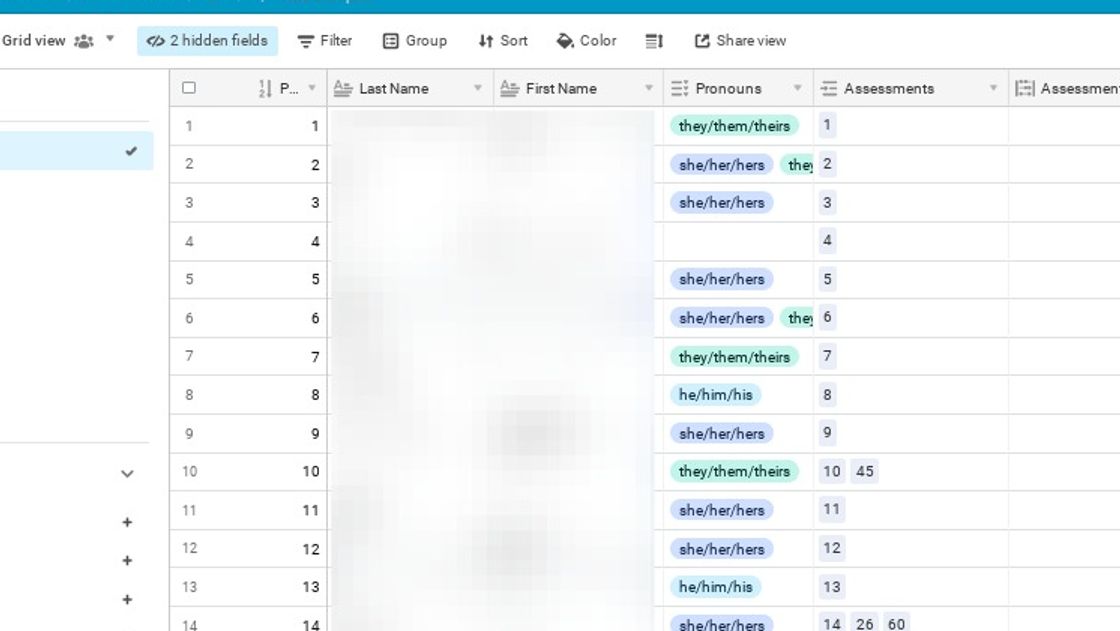
The "Patients" table contains a list of active patients, relevant information like their pronouns, and a linked field that links to the "assessments" table.
The "practitioners" table stores information about all of Maks' practitioners
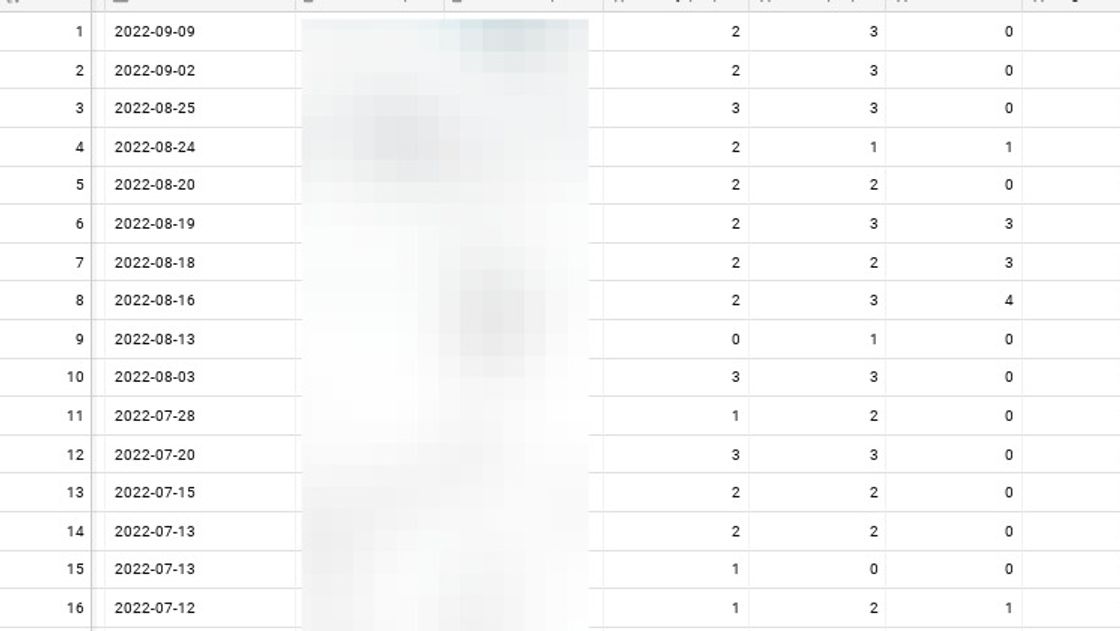
The "assessment" table stores all of the information that Maks and his team captures during an assessment including both qualitative information and numeric data about a patient's pain and symptoms
Our goal is to create an interface that makes it easier to see how this data changes over time, so we're going to create a Glide Page.
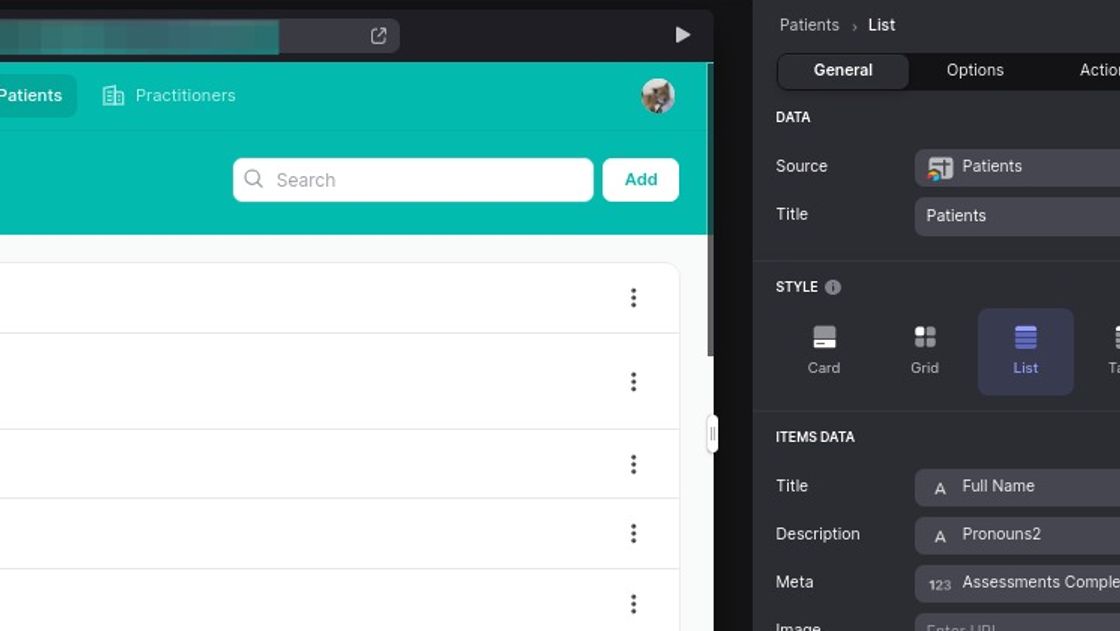
The primary page we're going to set up is going to display a list of all patients, as well as their pronouns and how many assesments we have on file. Patients can also be added to the database by a practitioner using the "Add" button next to the search bar.
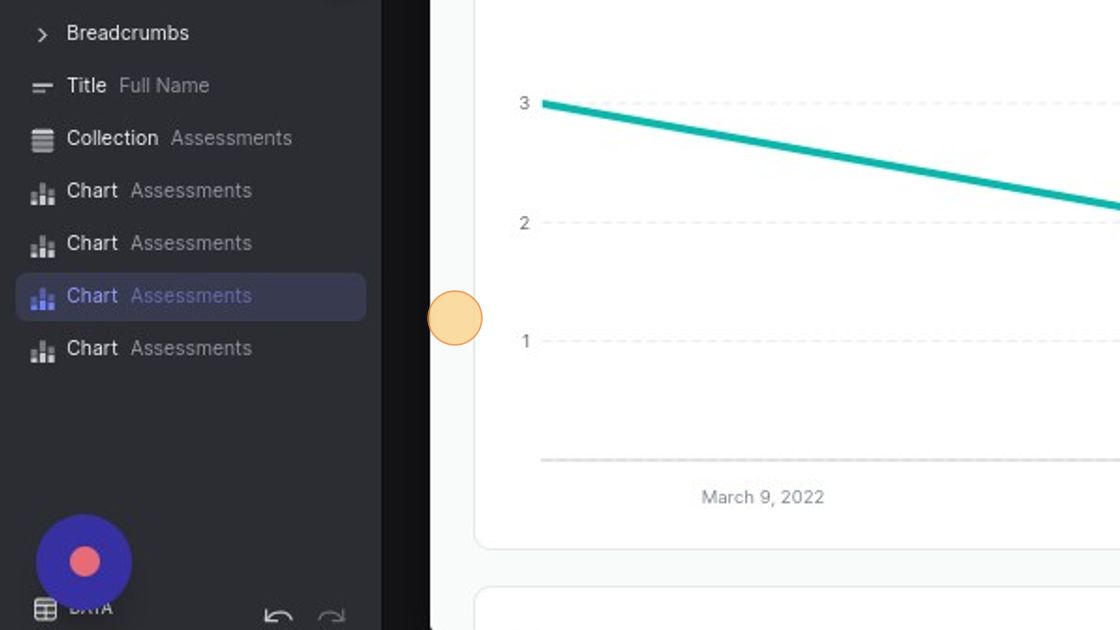
Now we're going to configure the details page by clicking on any patient that has more than one assessment.
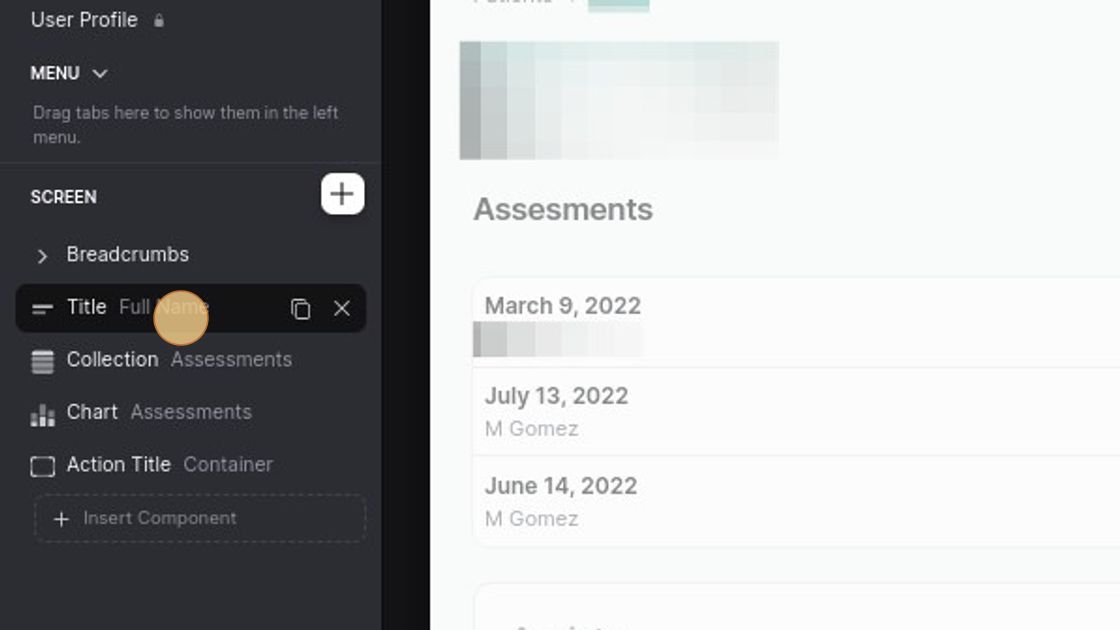
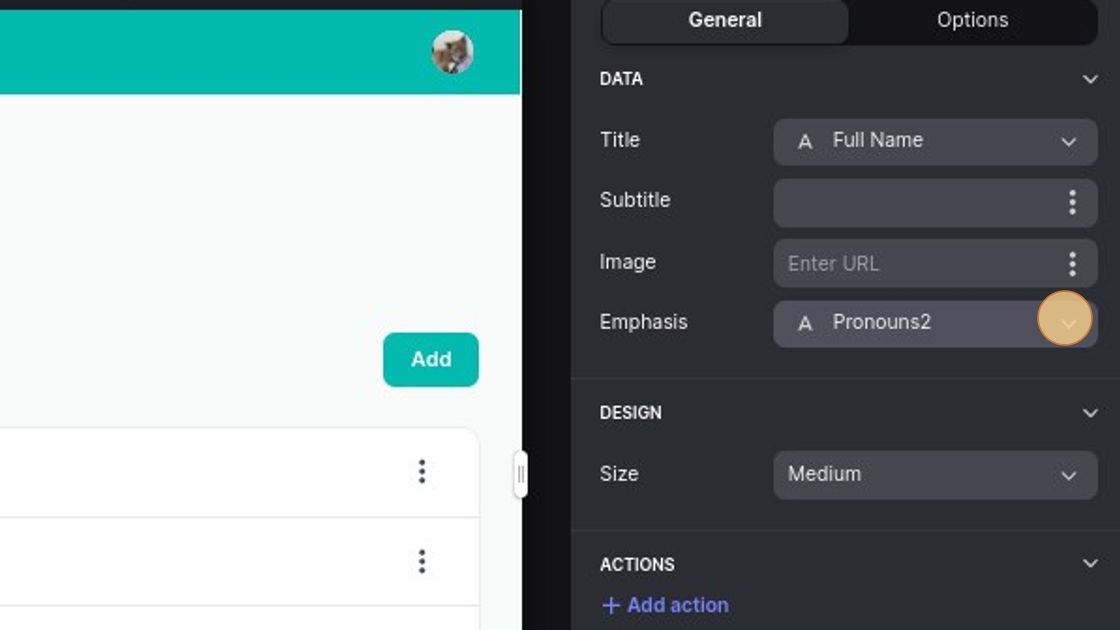
For our title block, we want to list the patient's name and pronouns.
The next block uses linked Assessments as a source (In Glide, the arrow means linked records only) and displays them as a list so the practitioner can review previous assessments before and during an appointment
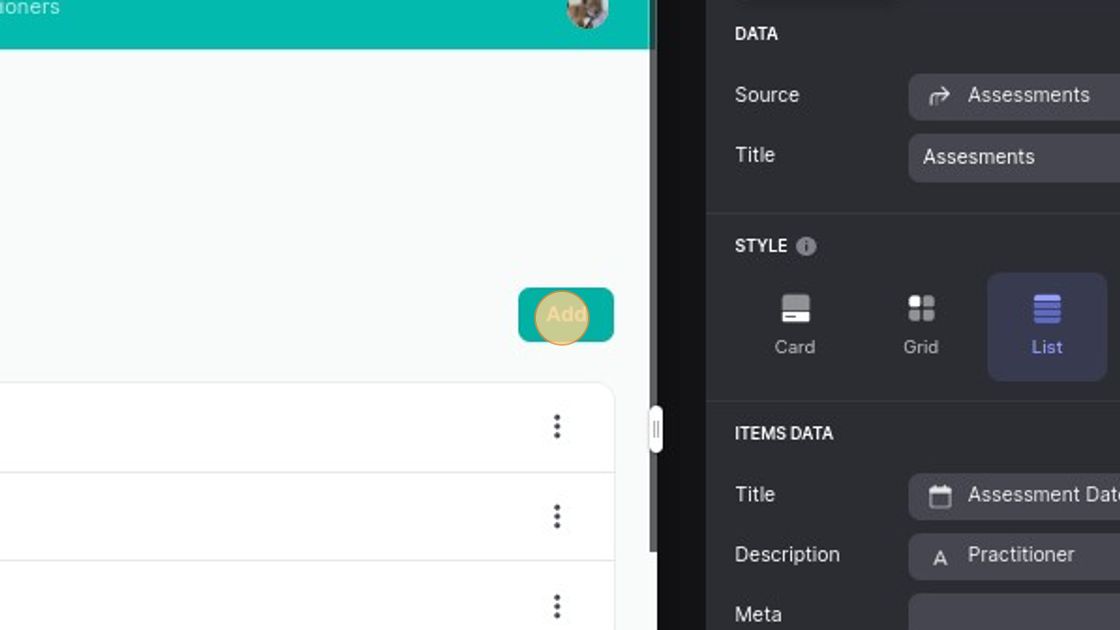
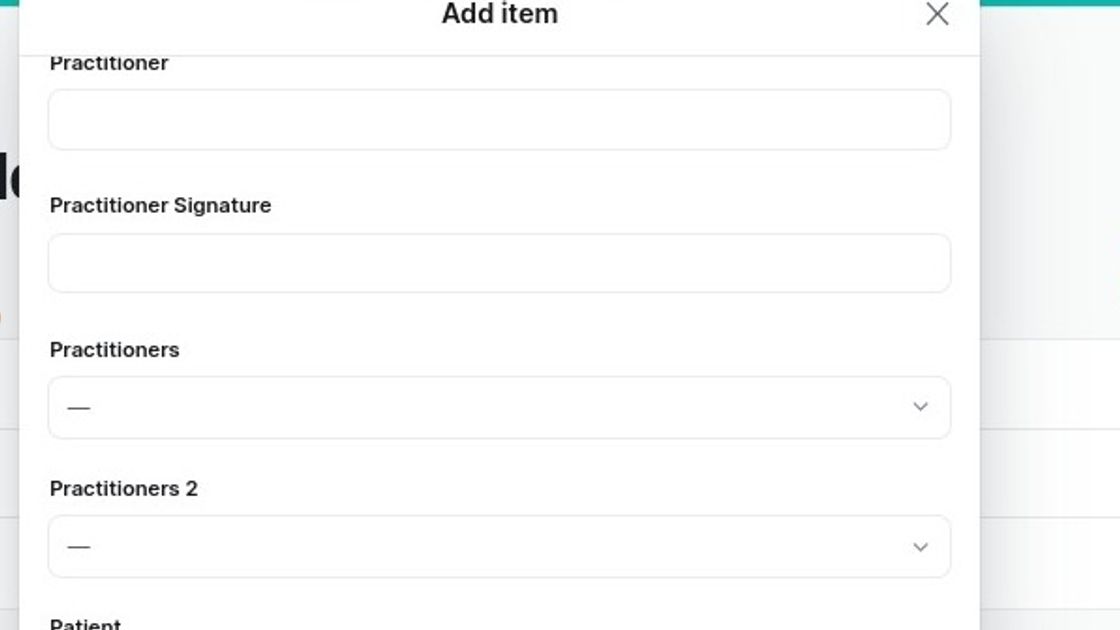
By clicking the "Add" button, we can configure an assessment form so that practitioners can add new assessments from this page. **
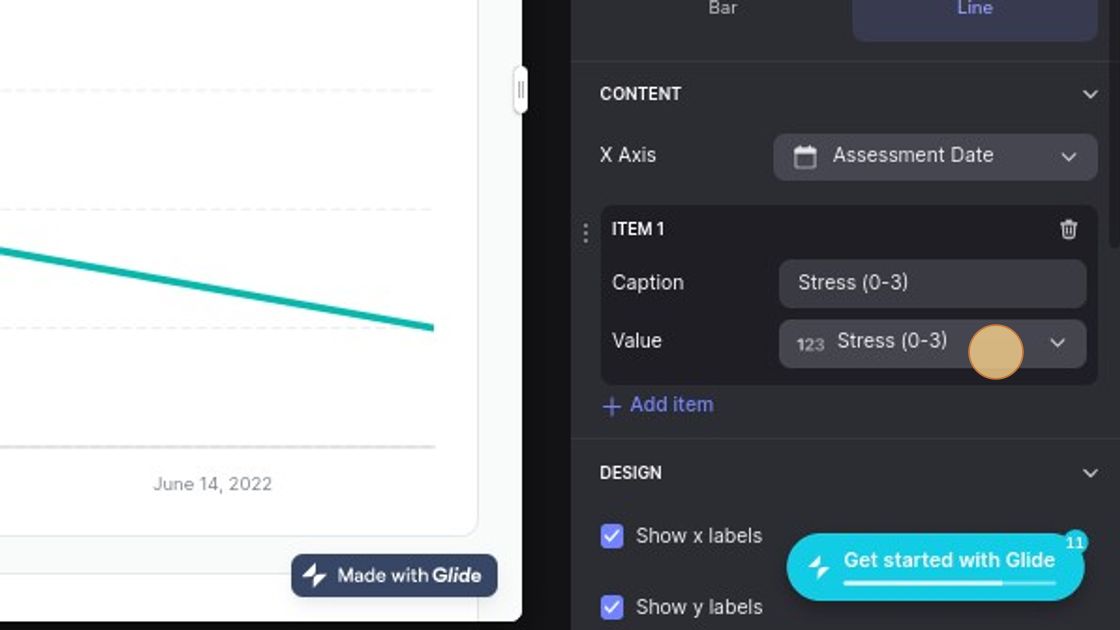
We want to summarize visually how the numeric values given during patient assessments change over time, so we're going to create a "chart" block next
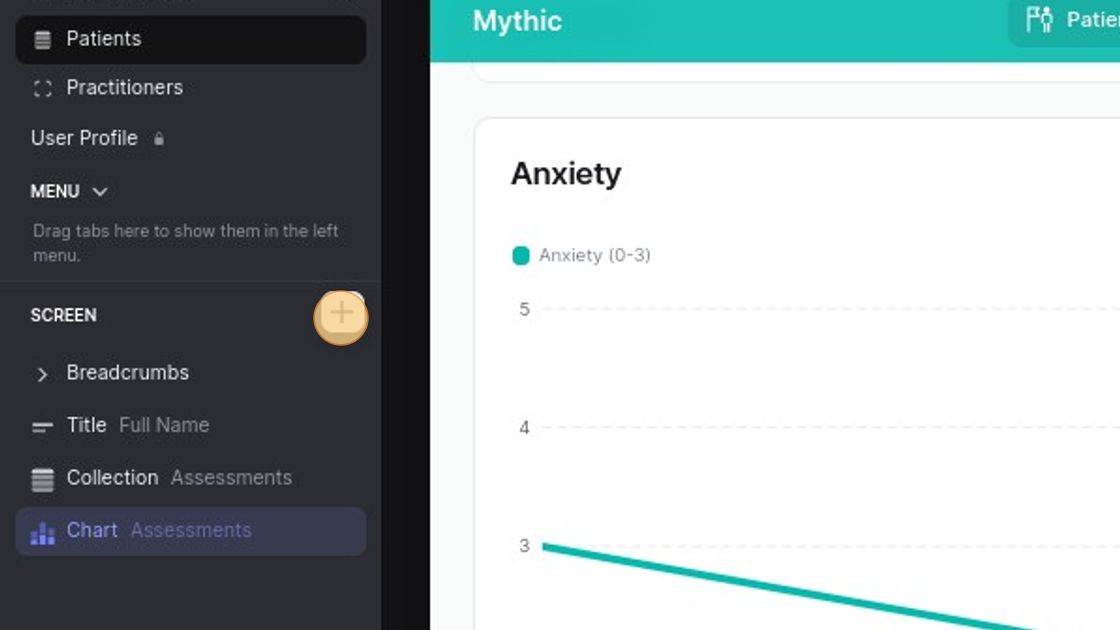
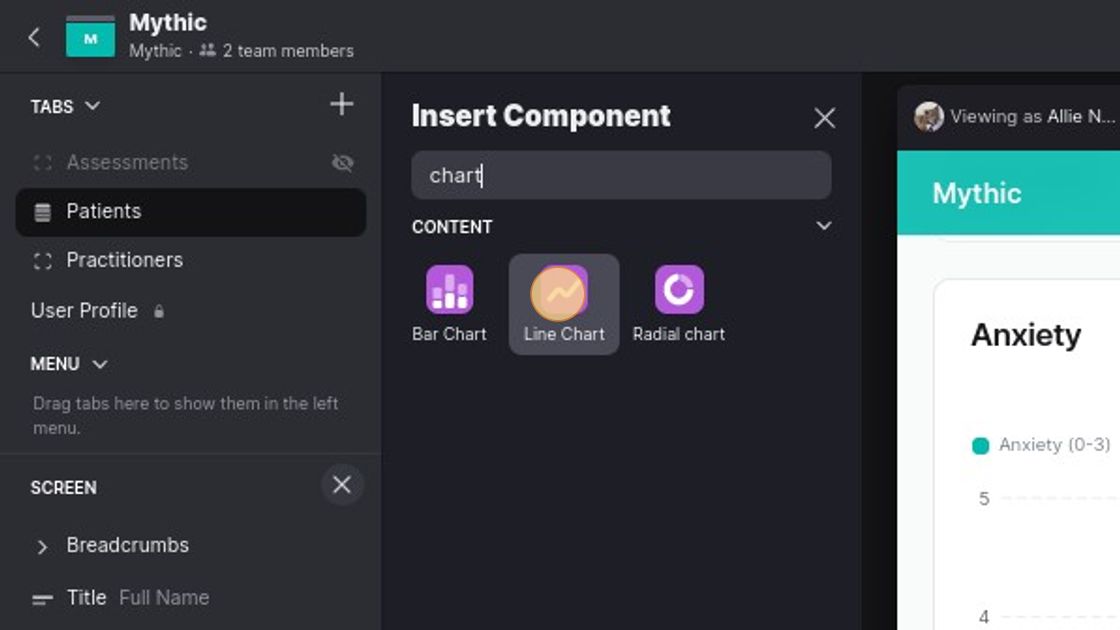
There are several types of chart available, but we're going to choose line chart
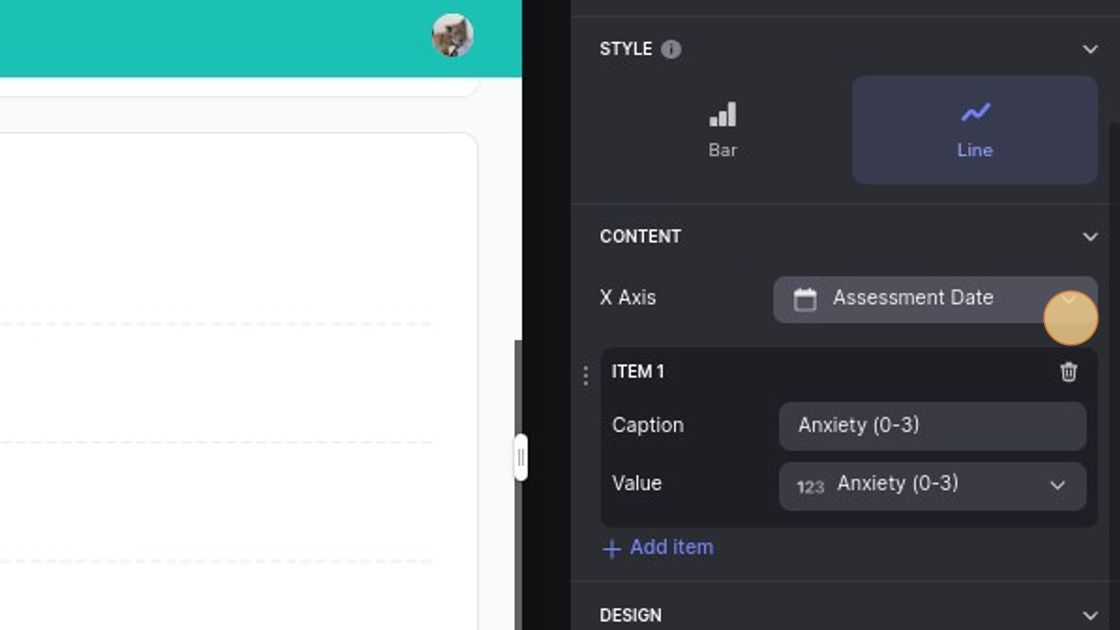
The "X" axis is going to be assesment date and the caption and value are both going to be "anxiety"
We're going to duplicate this chart so that we can have a separate graph for every numeric value in the assessment. **
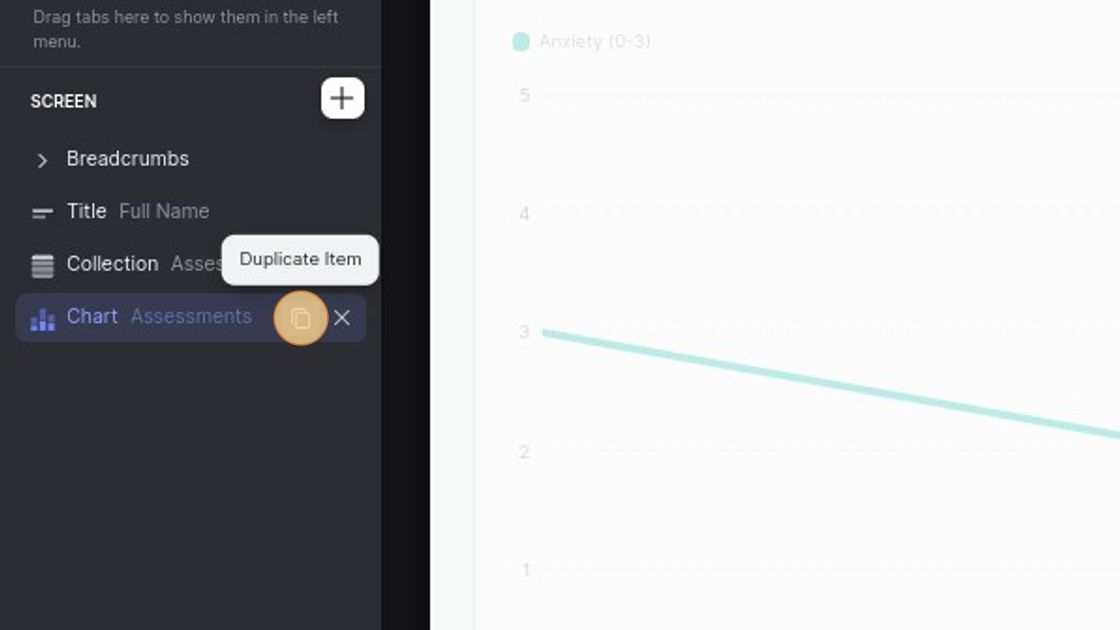
This graph is going to track "Stress"
And we're going to keep doing this until we have a chart for every value
And we’re done! The end result looks like this-easy to read, easy to navigate, and mobile friendly.
This tutorial was Made with Scribe
Looking for an incredible, queer friendly, inclusive massage therapist in Charlotte NC? Check out Mythic Massage